Experimental Engineering · Acoustics
Team project
Portable Air Conditioner Acoustic Analysis
Measurements · Signal Processing · FFT · PSD
Experimental acoustic analysis of a portable air conditioner under multiple operating conditions using time-domain and frequency-domain signal processing.
Year
2026
Type
Team project
Tools
Python · FFT · PSD · Signal Processing · Measurement Analysis
My Role
Experimental Analysis · Signal Processing · Engineering Data Analysis
01 / Overview
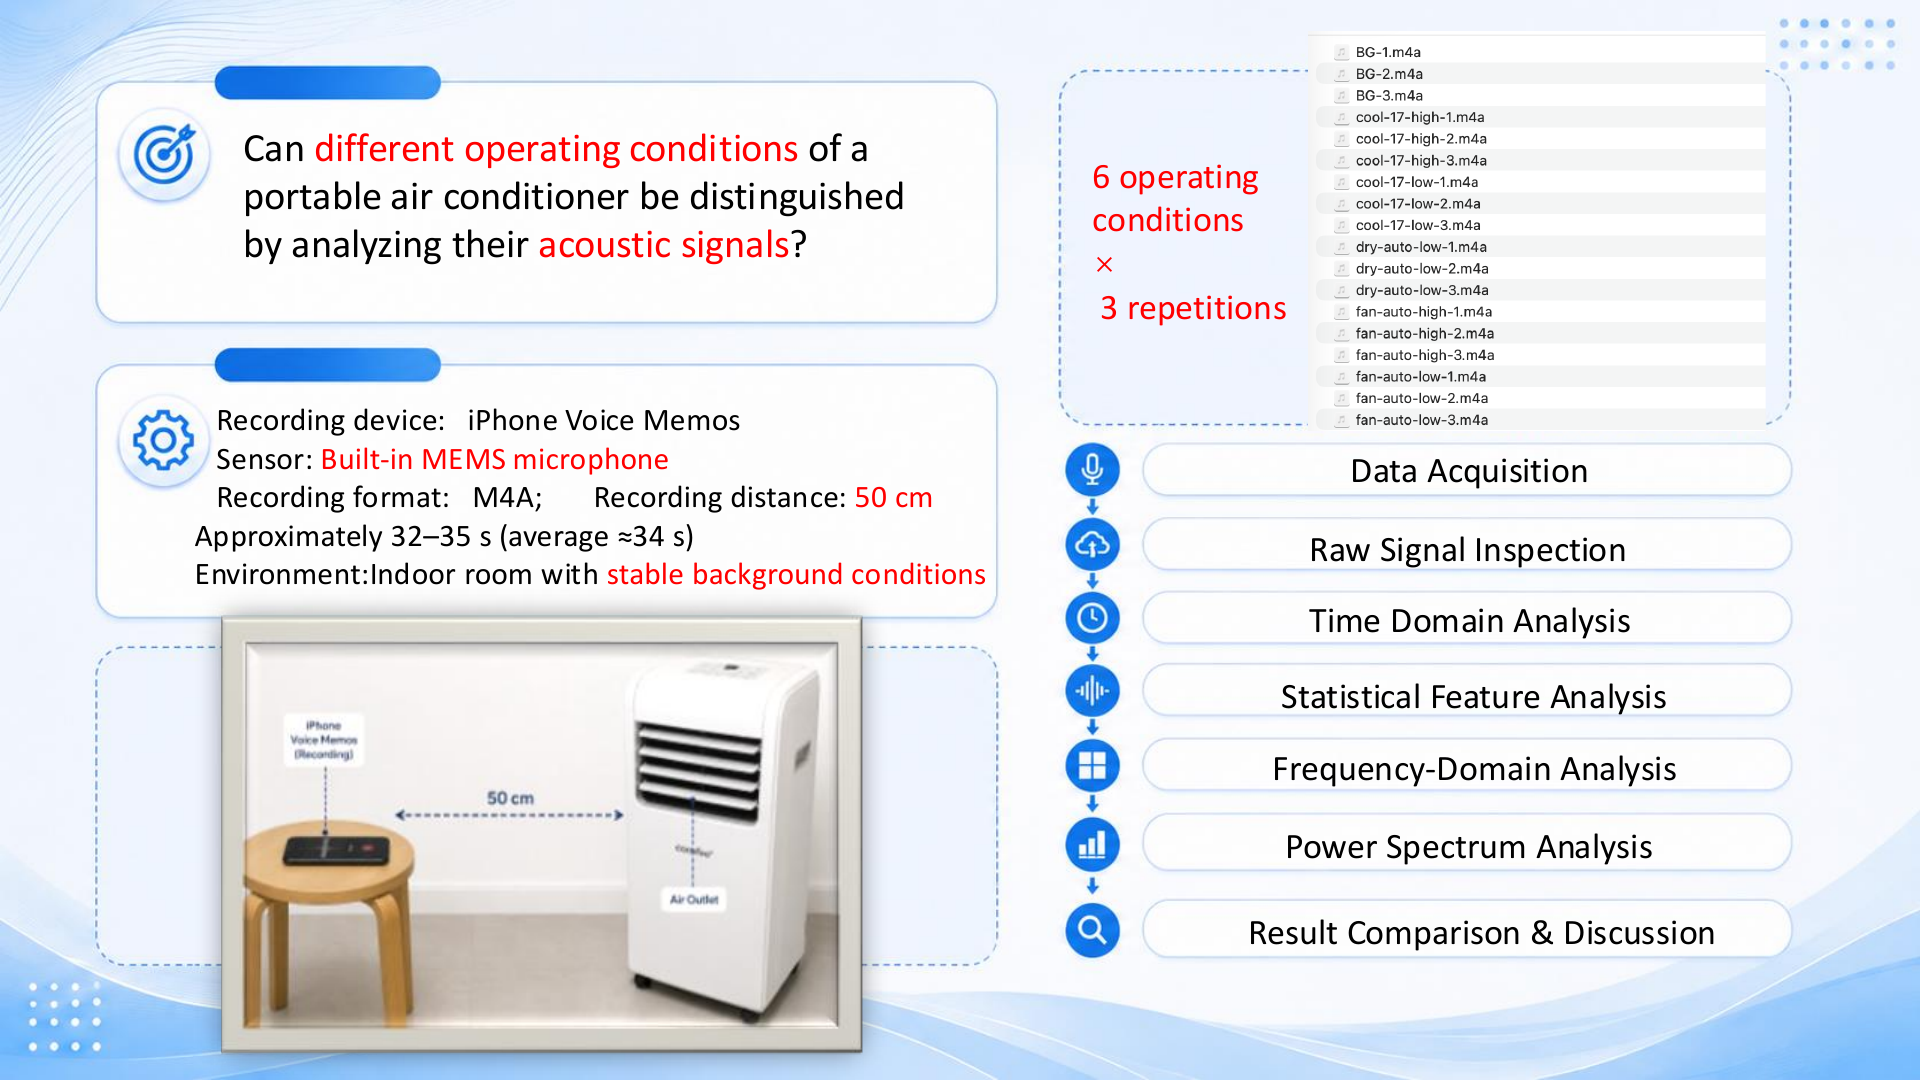
The study asked whether six operating conditions of a portable air conditioner could be distinguished from their acoustic signals. Eighteen recordings were collected and processed through a consistent time-domain and frequency-domain workflow.
Problem / Challenge
The signals included start-up transients, ambient background, compressor cycling and measurement variability. Global loudness alone could not explain overlapping operating modes, so data quality, repeatability and spectral distribution all needed to be evaluated.
Objectives
- 01Acquire three repeat measurements for six operating conditions
- 02Establish a consistent 5-25 s analysis window
- 03Check DC offset, clipping, SNR and RMS repeatability
- 04Compare FFT, power spectrum and PSD behavior across modes
- 05Translate spectral differences into engineering observations
02 / My Contribution
Team project · My contribution is identified below
In the six-person team, I contributed to signal preprocessing and the Hann-windowing workflow, supported FFT and PSD comparison, and helped interpret repeatability and frequency-band results. Data acquisition, statistical checks and the final conclusions were developed collaboratively.
03 / Engineering Process
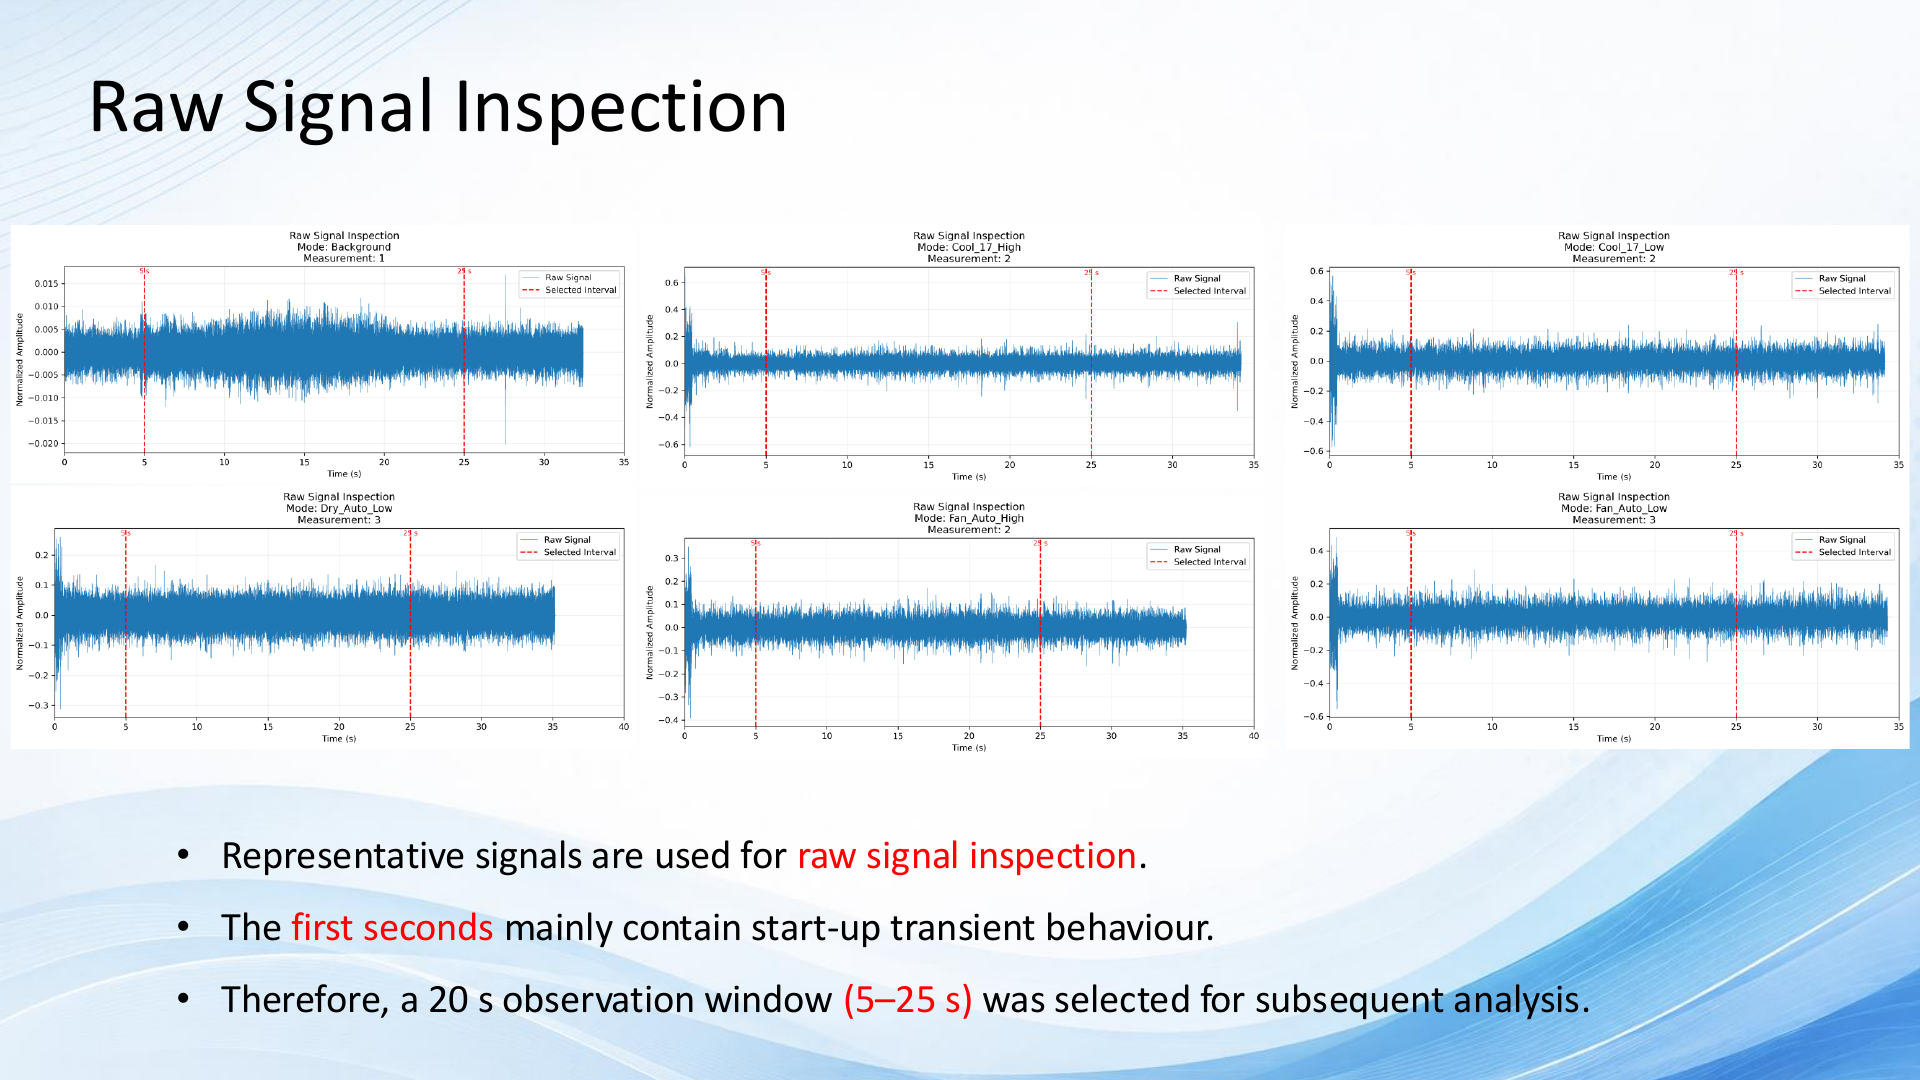
Recordings were made at 50 cm using a smartphone MEMS microphone under stable indoor conditions. Six modes were repeated three times. A 20 s segment from 5 to 25 s removed most start-up behavior, giving approximately 960,000 samples per record at 48 kHz and a nominal 0.05 Hz frequency resolution.
04 / Technical Development
The pipeline removed the mean, checked peak level and applied the same Hann window to every selected record before FFT. Time-domain observations were quantified through RMS, peak amplitude, SNR and coefficient of variation. The spectral workflow used one-sided FFT amplitude, power spectrum and PSD normalization for comparable results.
05 / Analysis / Validation
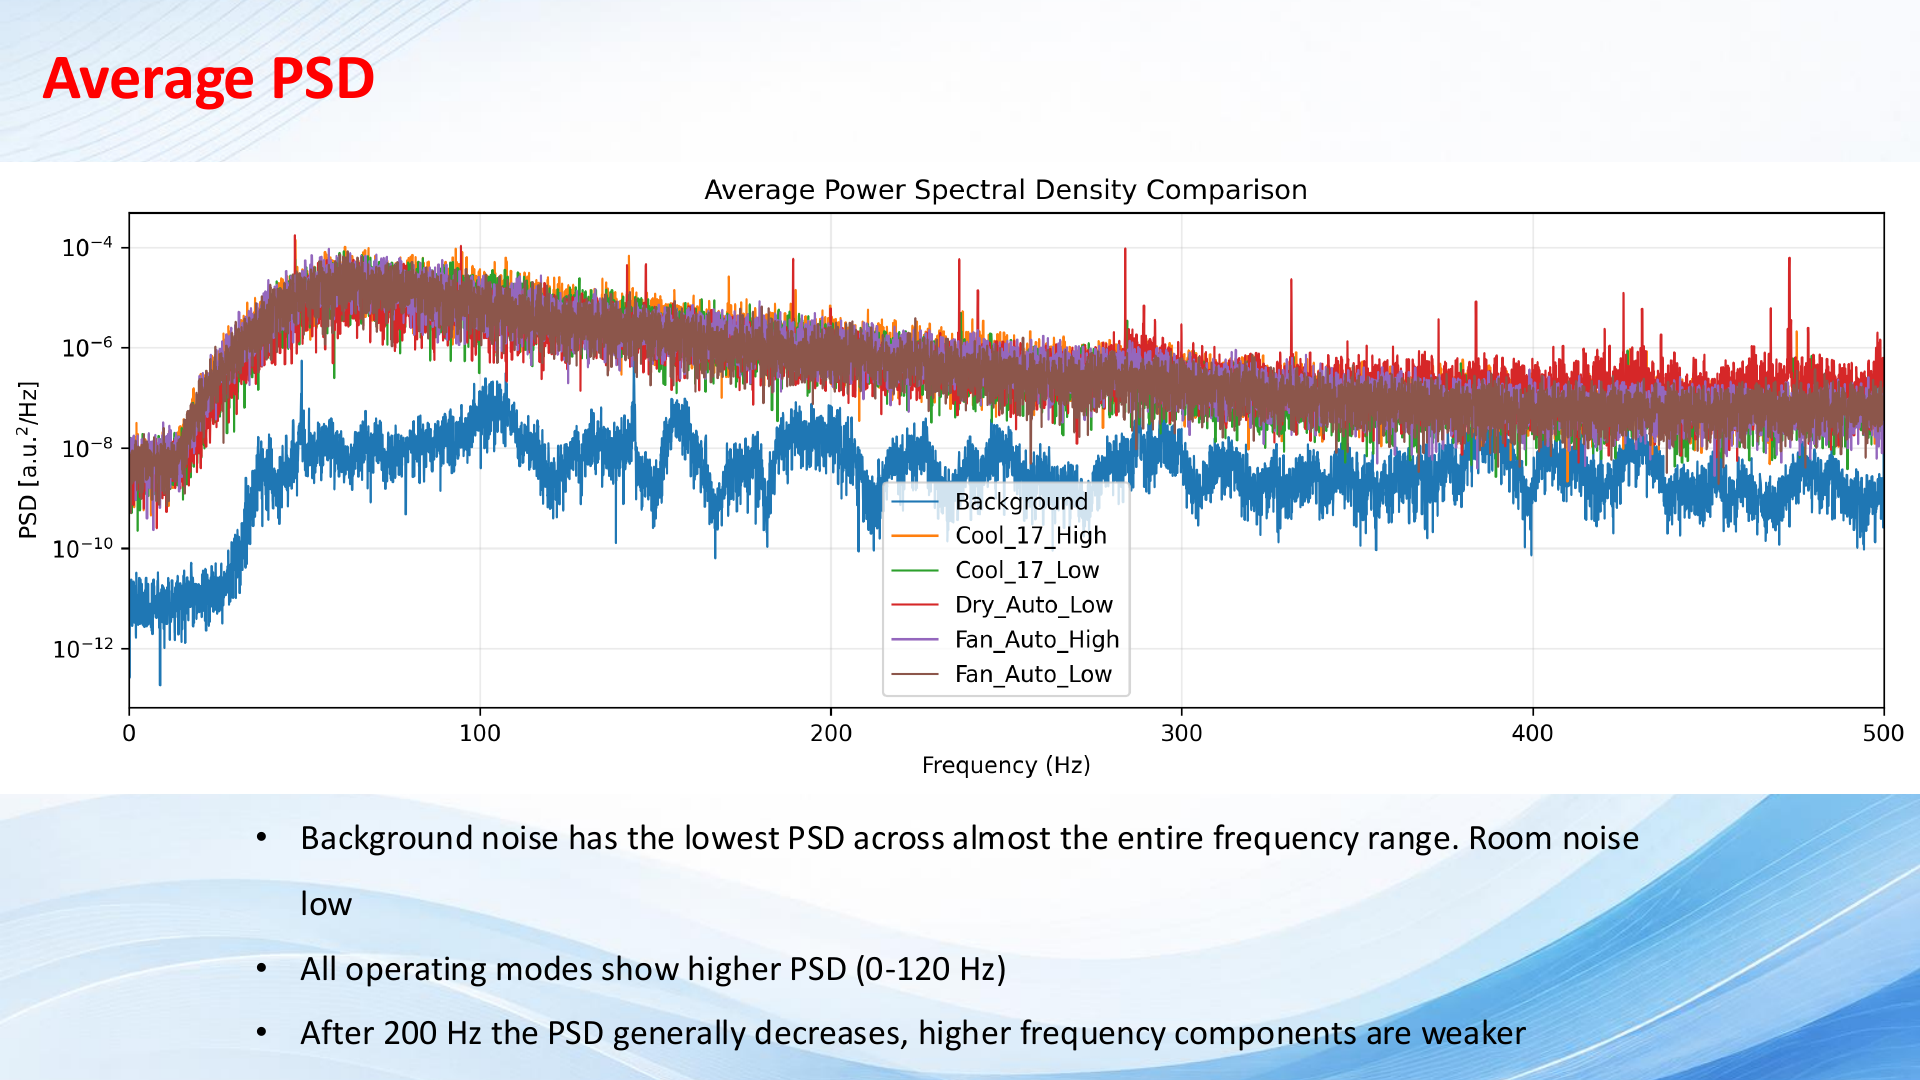
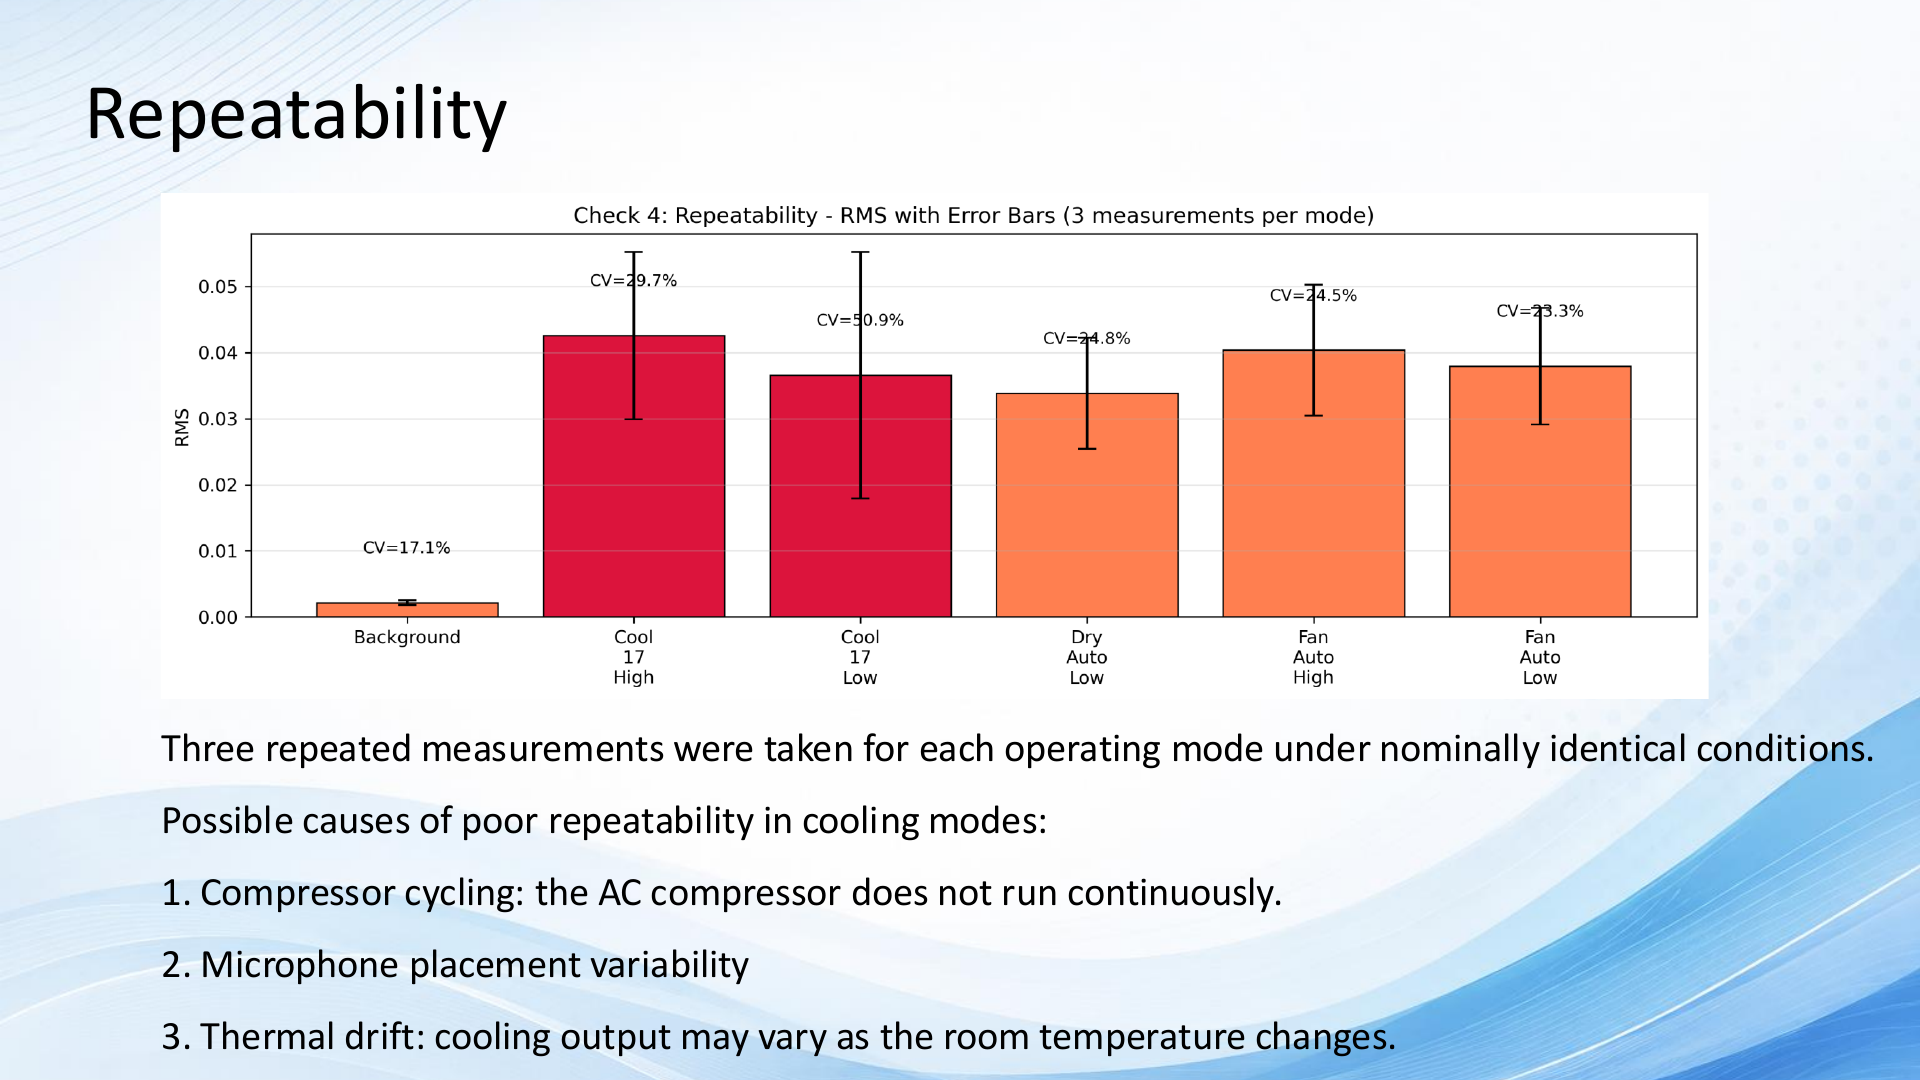
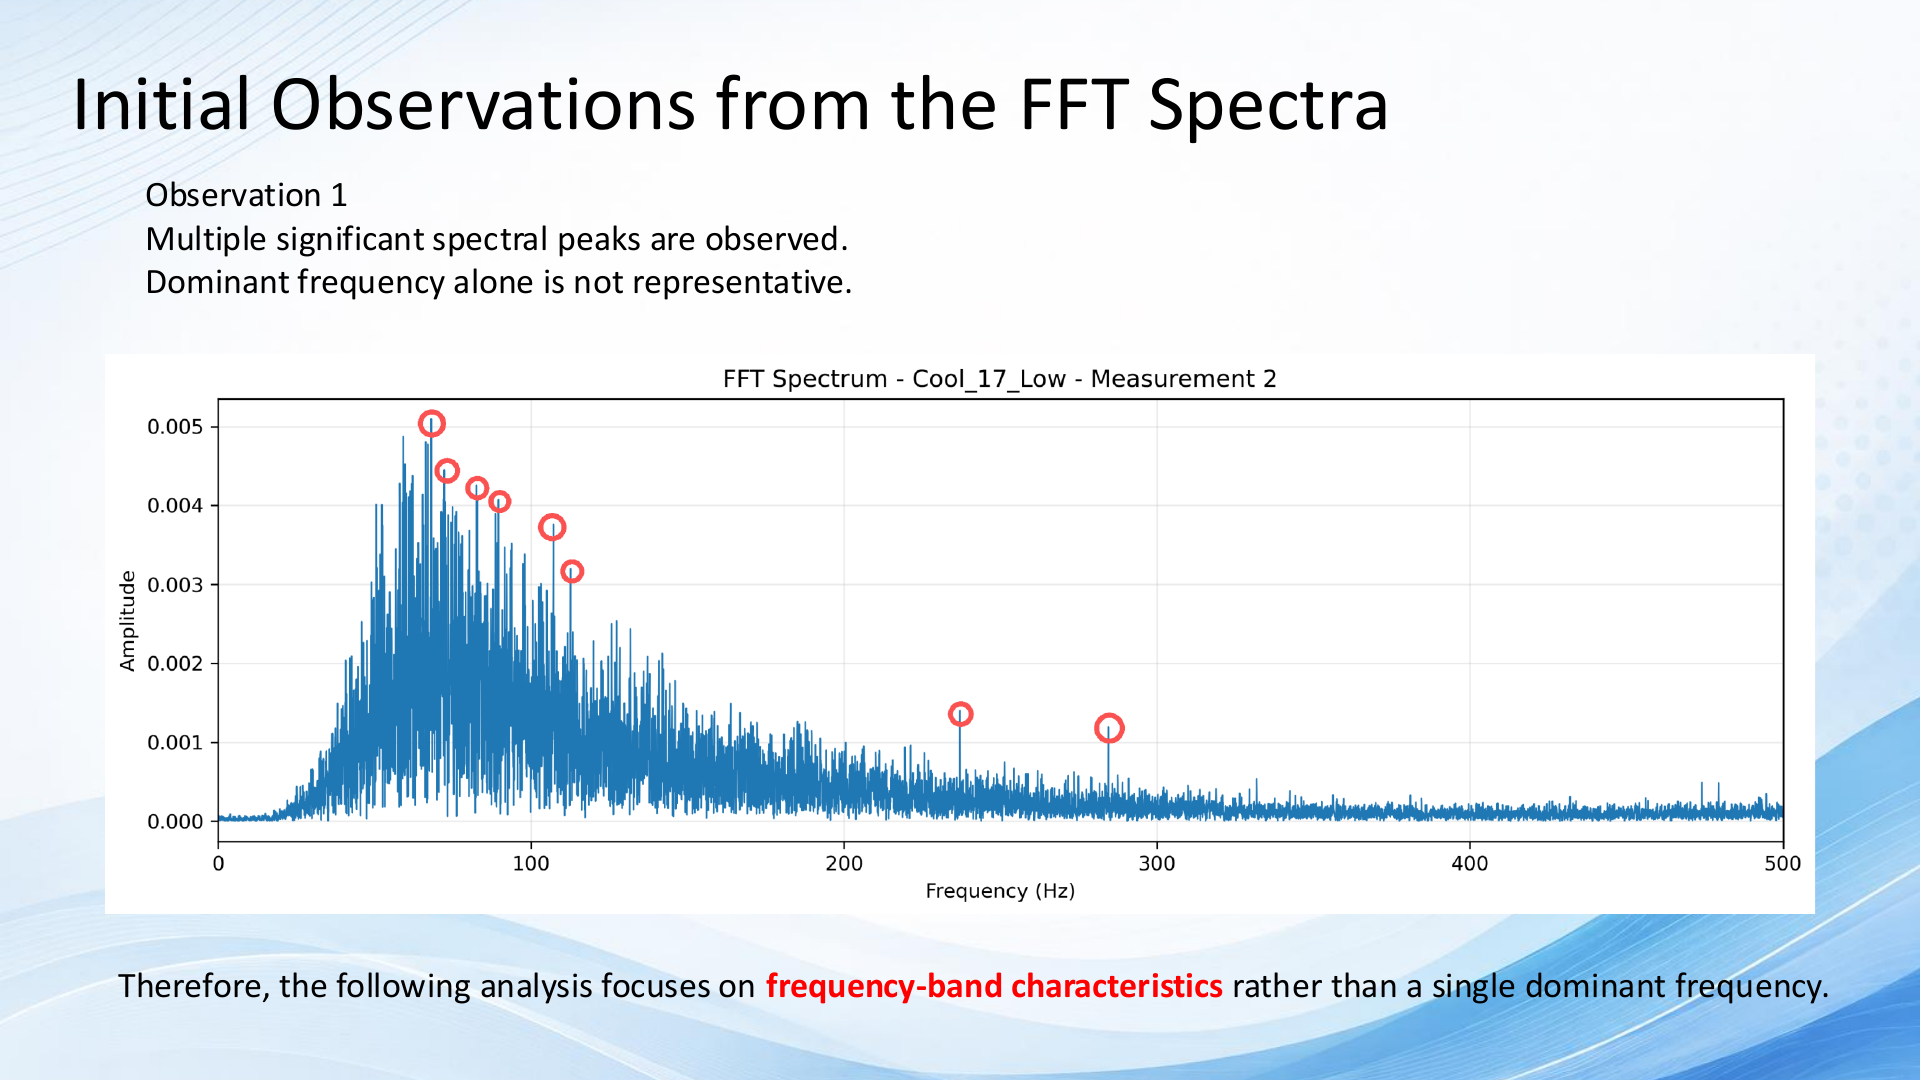
All operating modes remained more than 23 dB above the background reference and no clipping was detected. Cooling modes showed poor RMS repeatability, consistent with compressor cycling and placement sensitivity. FFT and PSD plots showed strong low-frequency content and overlapping spectral shapes, so frequency-band characteristics were more informative than a single dominant peak.
06 / Final Result
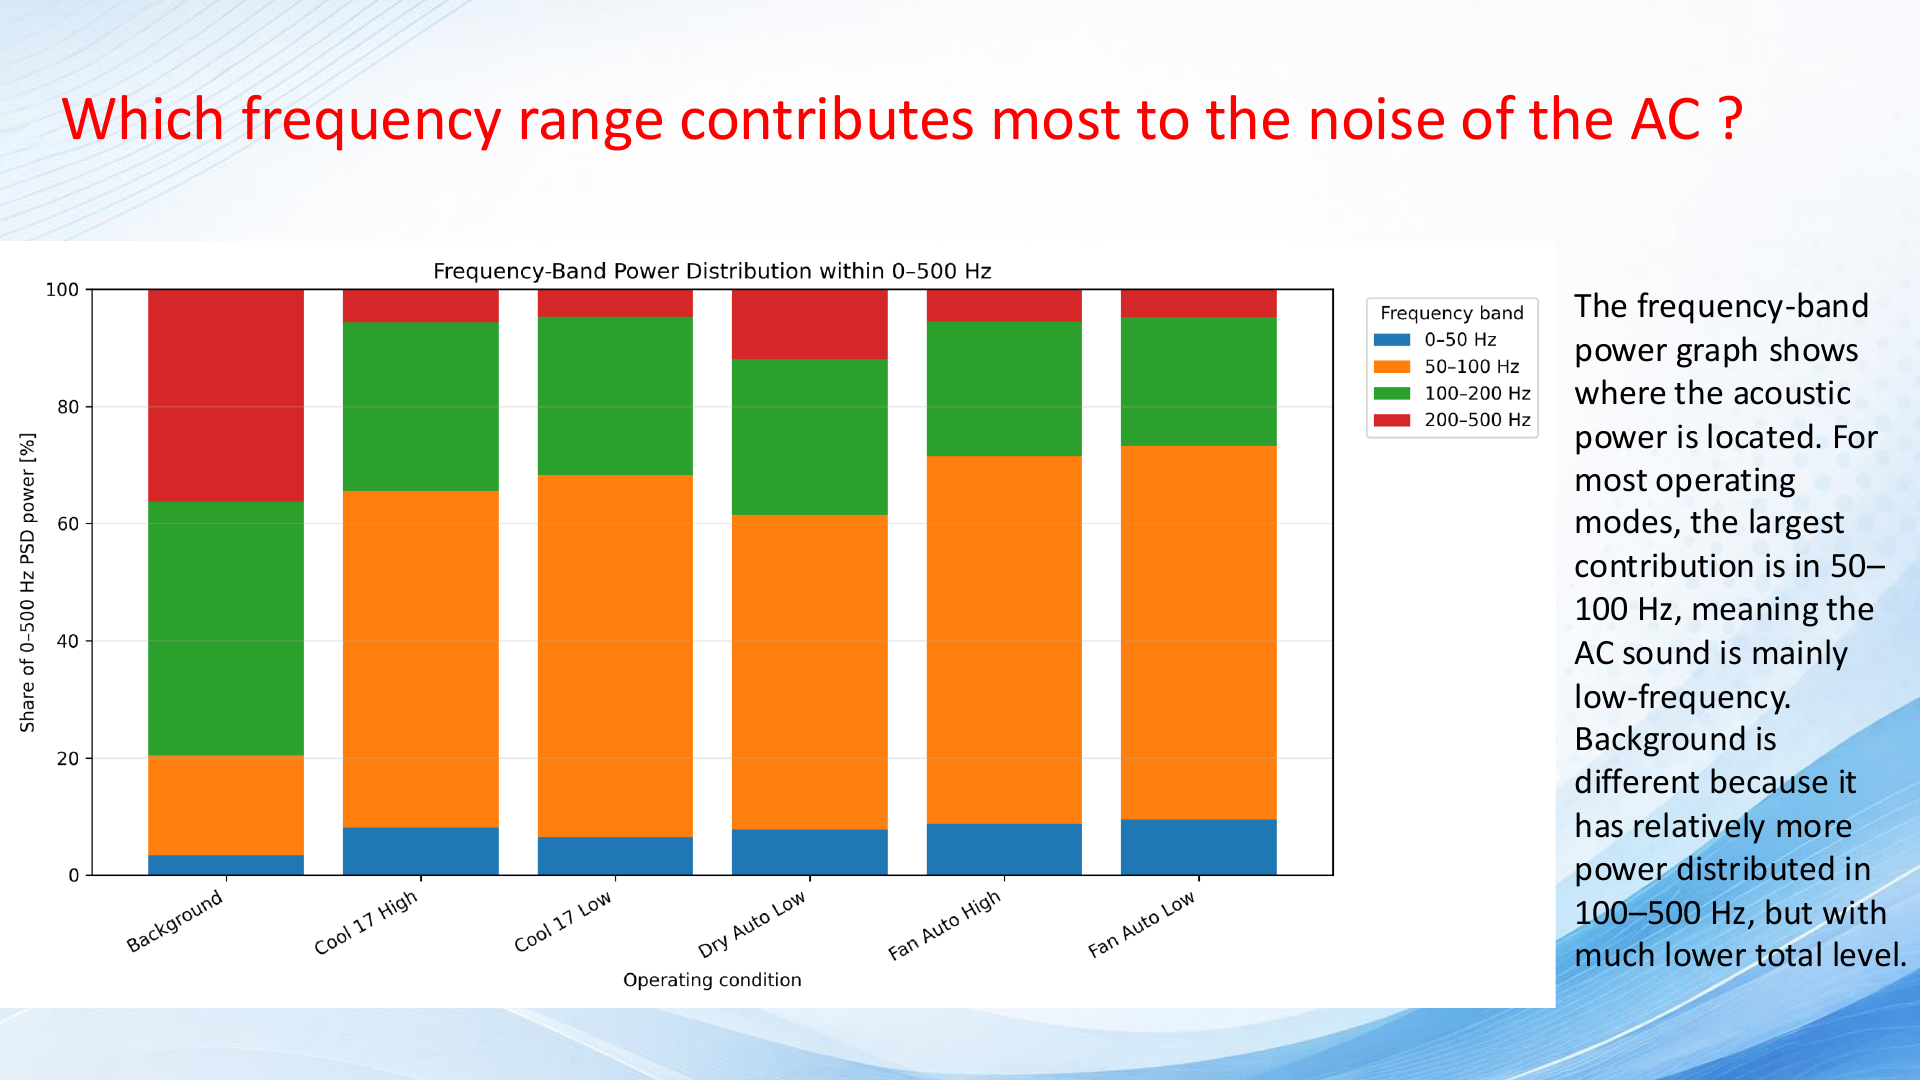
Background noise was clearly separated from operating conditions, and most air-conditioner energy was concentrated below 200 Hz, with the largest share commonly in the 50-100 Hz band. Cool 17 High produced the highest RMS-from-PSD level in the reported comparison, while mode classification remained limited by spectral overlap and repeatability.
07 / Key Learnings
A trustworthy measurement story must include uncertainty and repeatability, not only clean plots. Windowing reduces leakage but changes amplitude interpretation, and a single scalar metric cannot represent complex operating noise. Future work should add calibrated instrumentation, tighter placement control and time-frequency analysis.
08 / Tools / Methods
Next Project · 01